
Imagine a weekly client review. Collections look stable, yet the authorization team has unresolved renewals, documentation is waiting for signatures and appeals are approaching deadlines. Those issues may not be obvious in the current cash total.
The leadership question is practical: which client needs attention today, and what action will change the outcome?
Keep financial measures and operational risk connected
Collections, accounts receivable and denial measures remain essential. HFMA's MAP Keys provide established revenue-cycle definitions, including remittance denial rate and net days in accounts receivable. Consistent definitions make comparisons more useful. [1]
Add a separate operational view for unresolved issues. Do not present your custom risk score as an industry-standard financial metric. Explain what it includes, how it is calculated and how recently the source records were refreshed.
Define revenue at risk before displaying it
For an internal operational dashboard, one workable definition is: the estimated unpaid expected reimbursement associated with distinct claim lines or encounters that have a verified, unresolved issue. This is a proposed management measure—not a forecast of certain loss or recovery.
If contracted allowance data is available, use it consistently. If only billed charges are available, label the amount “billed charges associated with flagged claims.” Do not call that figure expected collectible revenue.
Deduplication matters. A claim line with both a documentation issue and an authorization issue should appear once in the overall exposure amount. Its multiple causes can still appear in the drilldown. Similarly, a client with one flagged claim is not equivalent to a client with widespread operational problems.
Five questions your dashboard should answer
| Leadership question | Useful view | Definition to make explicit |
|---|---|---|
| Where is attention needed? | Clients with unresolved flags | Flag criteria and client severity thresholds |
| What amount is involved? | Estimated unpaid exposure | Valuation basis and deduplication method |
| What could expire? | Upcoming filing and appeal deadlines | Payer-specific deadline and evidence source |
| Who is moving the work? | Owner, next action and overdue tasks | Task due date versus external deadline |
| Did the action help? | Resolved items and confirmed payments | Resolution evidence and payment attribution |
A practical leadership view
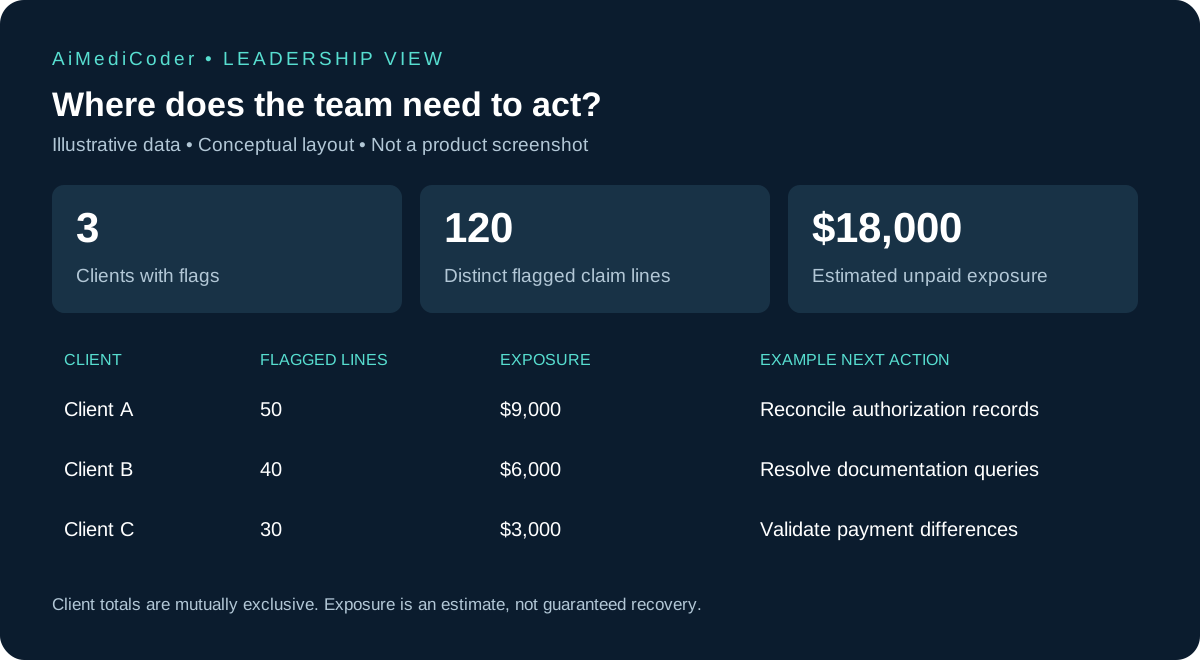
In this example, three clients have 120 distinct flagged claim lines representing $18,000 of estimated unpaid exposure. Client A accounts for $9,000, Client B for $6,000 and Client C for $3,000. Those are mutually exclusive client totals.
Within Client A, authorization and documentation issues may overlap. Adding their separate cause totals could therefore inflate the client exposure. Let leaders filter by cause while retaining a deduplicated portfolio total.
Also distinguish progress from outcomes. “Appeal submitted” means work has advanced. “Payment posted and reconciled” is evidence of a financial outcome. Moving an item to an in-progress queue should not automatically remove it from exposure.
Make every number lead to an action
A useful drilldown starts at the client, narrows to the payer or service group and reaches the relevant encounter or claim line. The underlying record should explain the issue, show its evidence, name the owner and state the next action.
Display source timestamps as well. A dashboard populated yesterday should not imply it reflects a payment posted this morning. Missing source data should appear as an explicit coverage gap rather than a green status.
For offshore teams, define handoffs with the provider's onshore staff. A documentation query might require a clinician's response, while an authorization investigation sits with a different team. The dashboard should show that dependency instead of marking the biller as responsible for every delay.
Use the dashboard in a short weekly review
Begin with approaching external deadlines. Then review the largest unresolved exposures and recurring causes. Finish by agreeing actions, owners and review dates. Record decisions so the next meeting starts with evidence of what changed.
Track whether repeated causes decline after intervention. Faster queue closure alone can look positive even if balances are written off or the same defect keeps returning.
Questions RCM leaders ask
Is revenue at risk the same as accounts receivable?
No. Accounts receivable includes outstanding balances; the proposed risk view isolates records with defined unresolved issues. Pre-billing risks may also sit outside billed receivables and should be shown separately.
Should we display a recovery probability?
Only when the estimate has a documented basis and is validated against actual results. Otherwise use transparent work categories and evidence rather than an impressive-looking percentage.
Can we start without replacing the billing system?
Yes. A controlled reporting process can begin with authorized exports or integrations. Data reconciliation, access controls and refresh timing still need clear ownership.
Source
[1] HFMA MAP Keys. Reference for established revenue-cycle KPIs. The custom exposure framework and fictional dashboard above are editorial examples, not HFMA definitions.